StatMate
Your sample size and power wizard.
Introduction
Using StatMate is entirely self-explanatory, and this example discusses the logic behind power analysis more than the mechanics of using StatMate. Learn the basic concepts of statistical power.&
We will continue analyzing the experiment discussed in the sample size example (Clinical Science 64:265-272, 1983). Now we’ll use power analysis to interpret the results.
We determined the number of alpha2-adrenergic receptors on platelets of people with and without hypertension. Here are the results:
Controls Hypertensives
| Number of subjects | 17 | 18 |
| Mean receptor number (receptors/platelet) | 263 | 257 |
| Standard Deviation | 87 | 59 |
The data was analyzed with an unpaired t test. Here are the results from Prism:
Because the mean receptor number was almost the same in the two groups, the P value is very high. These data provide no evidence that the mean receptor number differs in the two groups.
While it is tempting to just stop with the conclusion that the results are “not statistically significant” (as we did in this study published more than 25 years ago), there are two ways to go further. One approach is to interpret the confidence interval. But here we’ll use power analysis to evaluate the experiment.

Step 1: Choose Analysis
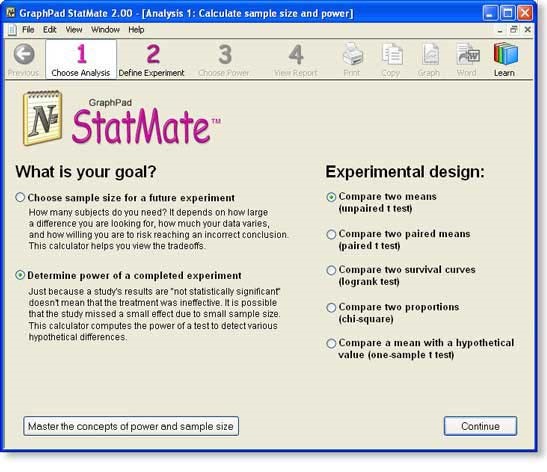
Choose the kind of analysis you want StatMate to perform by answering two questions:
What is your goal? For this example, we want to determine the power of a completed experiment. What is your experimental design? In this example, we plan to compare the mean of two groups using an unpaired t test.

Step 2: Enter SD And N For Each Group
Enter the results of the study.

Note that you do not need to enter the mean of the two groups. Mean values are not needed for power calculations. You need only enter the size and variability of the groups.
Step 3: Choose Power
StatMate shows us the power of the study (given the sample sizes and standard deviations you entered) to detect various hypothetical differences (delta).

Click the result with a power of 80%.
Step 4: View StatMate’s Report Of Power Analysis
Enter the results of the study.

The screen shot above shows the first two of three sections of the report: a reiteration of your choices, and a detailed interpretation. The report then shows the entire table of tradeoffs (which you have already seen). You can export the report to Word by clicking one button (Windows only) or via copy and paste
StatMate Features
Calculate sample size – How many subjects (data points) do you need? Naturally, the answer is “it depends”. It depends on how large a difference you are looking for, how much your data vary, and on how willing you are to risk mistakenly finding a difference by chance or mistakenly missing a real difference. StatMate helps you see the tradeoffs, so you can pick an appropriate sample size for your experiment.
Calculate power – Just because a study reaches a conclusion that the results are “not statistically significant” doesn’t mean that the treatment was ineffective. It is possible that the study missed a small effect due to small sample size and/or large scatter. StatMate calculates the power of a test to detect various hypothetical differences.
Choose from these experimental designs:
- Compare two means (unpaired t test)
- Compare two paired means (paired t test)
- Compare two survival curves (logrank test)
- Compare two proportions (chi-square test)
- Compare a mean with a hypothetical value (one-sample t test)
