MAXQDA


Unlock 20% Off MAXQDA – Limited Time Offer
Get 20% off all MAXQDA licenses (Academia, Business, Non-Profit) for 3-year or 5-year plans, and on the first subscription cycle of 1-year plans! Enhance your qualitative and mixed-methods research with powerful features like AI-assisted coding, transcription, and seamless team collaboration.
Don’t miss out—contact us to get the promo code!
📩 Email info@sciexperts.com today.
Exciting news! MAXQDA 24.6 has just arrived, packed with powerful updates to enhance your research experience. This release introduces a sleek new interface theme and the innovative AI Assist ribbon menu, bringing you smoother, more intuitive tools.
Meet MAXQDA 24.6 –Smarter, Sleeker, and Free for You

ORGANIZE
Everything in one place
TRANSCRIBE AND ANALYZE
Get the most out of your data


NOTE AND SUMMARIZE
Get an overview
VISUALIZE
Understand how things connect

PUBLISH
Share your research with the world
World-leading mixed methods software
Intuitive and easy to learn
Efficient teamwork
Comprehensive customer support
Identical on Windows & macOS

INTERVIEW ANALYSIS WITH MAXQDA
SOLUTIONS
Transcribe your Interviews


Code your Interviews
Create codes first and then assign a code to a text segment via drag and drop. Boost your workflow using the code name suggestions and quickly resize coded segments with the grabbers. Code in-vivo as you are reading your interview transcript, creating codes directly from words or phrases within the interview. For focus group transcripts, use codes and documents created with the automatic speaker recognition to analyze either on a group level or on an individual level.
Deepen your Interview Analysis
Keep track of your ideas, the consideration behind your analyzing steps, and new insights that develop organically through the analysis process using MAXQDA’s Memos functions. Use the Paraphrasing Tool to summarize specific segments of the text with your own words and condense a large amount of data into an easy-to-read overview with the Paraphrase Matrix. Explore how a word or phrase is used in your interview data in an interactive dashboard of the Word Explorer. Collect relevant insights from your interview data and develop new theories using the new QTT.


Visualize and Publish your Data
Create an overview of both of your data and of your data analysis for yourself and for presentations. Export ready-for-print reports or create powerful visualizations and statistics to illustrate your results and share findings with stakeholders.
LITERATURE ANALYSIS WITH MAXQDA
Build a theoretical framework around your data.
All-in-one Literature Review Software
Use MAXQDA to manage your entire research project.
Easily import data like texts, interviews, focus groups, PDFs, web pages, spreadsheets, articles, e-books, and even tweets. Organize your data into groups, link relevant citations together, and share and compare work with your team members. Your project file remains flexible and you can gradually expand and refine your category system to fit your research.


Import & automatic pre-coding
MAXQDA can work with all reference management programs that are able to export their data-bases in RIS-format, containing all collected bibliographic information, such as author, title, links to websites, keywords, abstracts, full texts and other information. During import, the documents are automatically pre-coded to facilitate later search and retrieval.
Idea Storage
When reviewing the literature, good ideas and insightful connections come up often. Record these, such as research questions and goals, in Memos or use them to paraphrase passages into your own words. Especially useful for literature reviews are free Memos you write as you work on the review, from which you can copy and paste passages into the final text.


Search & Retrieve Functions
With MAXQDA’s Text Search you can search and automatically code interesting keywords, such as important concepts for your literature review. The automatically created document variables can be used with Mixed Methods tools and you can use MAXQDAs powerful Coding Query, which allows you to analyze the combination of codes in different ways.
A look at the Bigger Picture
MAXQDA offers overview tables for almost everything – Memos, coded segments, links, and so on. You can also use summary tables that effectively compare and present condensed summaries of sources. They can easily be integrated into your literature review report.


Quantitative evaluation of themes
Quantitative aspects can also be relevant in a literature review. For example, sort sources according to document variables and compare values with frequency tables and charts. Don’t miss MAXDictios word frequency functions, which make quantitative analysis of terms and their semantic contexts even easier.
TAKE YOUR QUALITATIVE ANALYSIS TO THE NEXT LEVEL.
Mixed Methods Research with MAXQDA
Your all-in-one Mixed Methods Software
Use MAXQDA to manage your entire research project. Easily import data from texts, interviews, focus groups, PDFs, web pages, spreadsheets, articles, e-books, and even tweets and YouTube comments.
Enrich your research with quantitative data
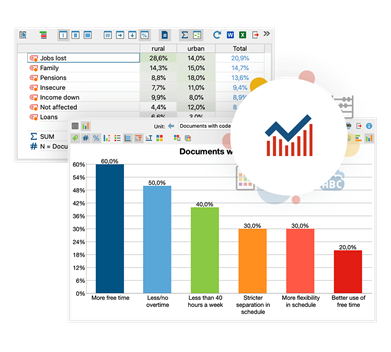
MAXQDA is the mixed methods expert! With MAXQDA you can easily combine qualitative and quantitative methods to get an even deeper insight into your data. MAXQDA offers mixed methods tools, quantitative text analysis tools in MAXDictio, the add-on module of MAXQDA Plus, and statistical analysis in the Stats module of MAXQDA Analytics Pro.
Quantitize your qualitative coding information
Import and export quantitative data matrices to and from statistics software packages like SPSS. Turn your codes into variables for a statistical analysis, automatically or manually assign variables to your data, and export any part of your project to a spreadsheet. Analyze your answers to open-ended questions with powerful features and link them with MAXQDA Stats and MAXDictio with one single click.

Create and compare groups
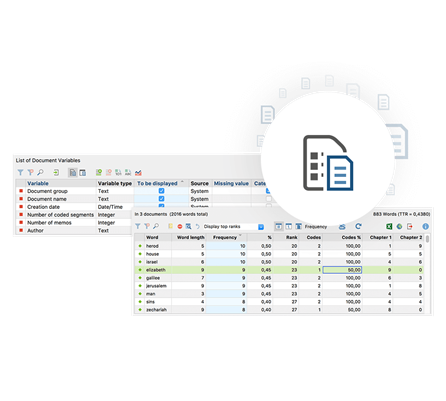
With MAXQDA’s tools you can easily create and compare the code frequencies of various groups with each other or identify and quantify similarity or dissimilarity in code frequency across your data. Calculate various variables and their percentages for qualitative typologies. Especially useful for mixed methods research are MAXQDA’s joint displays that visualize integrated data and/or results.
Visualize your results
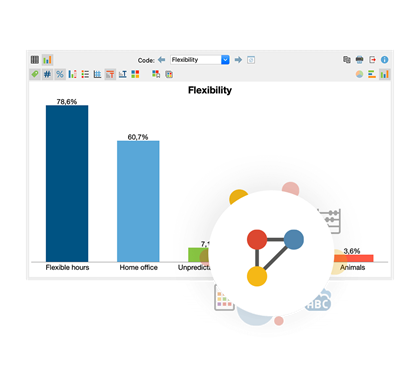
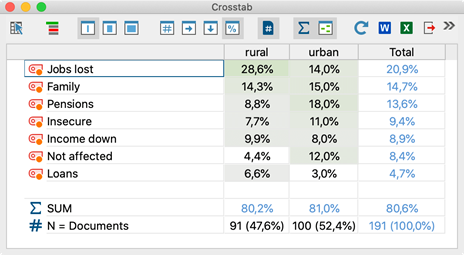
With the help of the Statistics module, MAXQDA can create stunning frequency tables and charts which indicate the frequency of subcodes. The colors and captions of your charts are editable, and the result can easily be exported and fits perfectly into your report or presentation.
DEVELOPED BY AND FOR RESEARCHERS.
Content Analysis with MAXQDA
All-in-One Content Analysis Software
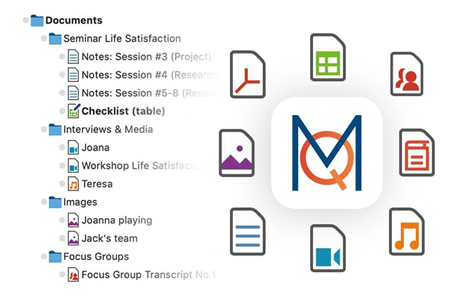
Use MAXQDA to manage your entire research project. Easily import data from text documents, interview transcripts, focus groups, online surveys, web pages, images, audio and video files, spreadsheets, bibliographic data, YouTube data, and even tweets. Organize your data in groups, link relevant quotes to each other, and share and compare work with your team members. Your project file remains flexible and you can gradually expand and refine your category system to fit your research.
Paraphrasing
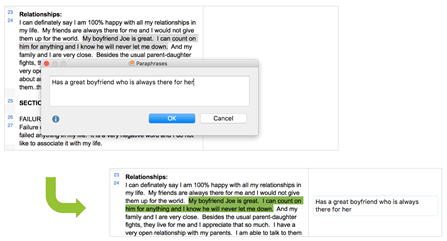
Summarize texts in your own words with MAXQDA’s handy paraphrase mode and display them directly adjacent to the text. You can also use your paraphrases for inductively forming new categories from your material.

Search keywords in your content
Search for keywords in your data, memos and coded segments and use MAXQDA to automatically code them. Make use of the extended search functions that offers you everything you might expect from professional content analysis software – and with the integration of retrieval functions, lemma lists, Boolean operators and wildcards, probably a little more.
Summarize your content
Aggregate your coded data to the next level of analysis by summarizing it on the dimensions of code, document, and coded segments in a document. With our summary grids and summary tables, you can keep crate compilations of summaries for determined topics.

Find connections in your data
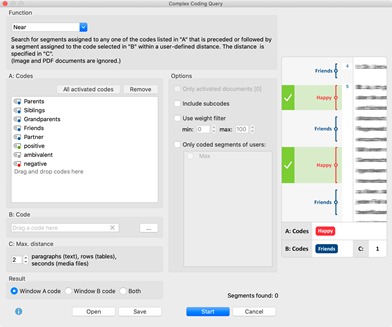
The activation system for retrieving data segments is surprisingly simple and easy to use. But there’s more that meets the eye: our Complex Coding Query gives you a total of 9 further retrieval functions for finding connections in your data.
MAXDictio for Quantitative Content Analysis
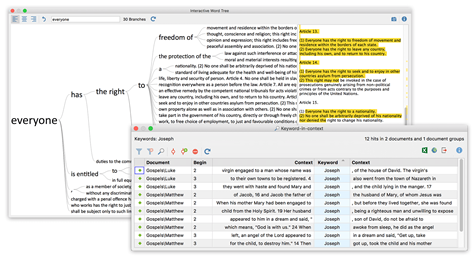
Use the tools offered by MAXDictio, our module for quantitative content analysis, for an even deeper analysis. You can display frequencies of individual words or word combinations in tables or visualize them in the Interactive Word Tree. Use the Keyword-in-Context function to transfer the textual contexts of selected words into a clear table.
Visualize your results
Whether for your analysis or publication, MAXQDA’s visual tools are tailor-made for qualitative research. Visualize the progression of an interview with the Codeline or use the Code Cloud to illustrate and explore your categories. Of course, MAXQDA offers many more powerful visualization tools for every purpose.
DEVELOPED AND FOR RESEARCHERS.
Questionnaire Analysis with MAXQDA
Whether your survey contains standardized or open-ended questions, with MAXQDA you can easily import and analyze both types. Options for a direct import of your data, analysis tools, tailor made for surveys, and the MAXQDA Stats module with a large range of tools for statistical analysis, make your questionnaire analysis surprisingly easy.


Direct Import from Survey Monkey, Excel & SPSS
Connect MAXQDA with SurveyMonkey to import your online survey directly into your MAXQDA project and analyze the data with MAXQDA’s tools. You can also import Excel spreadsheets and SPSS data. Of course, MAXQDA works with both response types, i.e. open-ended and standardized responses, and offers you numerous tools for analysis.
Organize your data and codes
Organize your data in groups, link relevant quotes to each other, and share and compare work with your team members. Your project file stays flexible and you can expand and refine your category system as you go to suit your research.


Categorize Survey Data
MAXQDA helps you analyzing responses to open questions in surveys efficiently and effectively with its interactive table window for categorizing survey data. With MAXQDA you can easily combine qualitative and quantitative methods to get an even deeper insight in your data. Search for words or phrases in your survey and auto-code search hits, sentences, or paragraphs with dictionary categories.
Statistical Analysis with MAXQDA Stats
MAXQDA Analytics Pro equips you with a large range of tools for statistical analysis. Seamlessly quantify your qualitative data and enrich your analysis with evidence and plausibility. With the integrated output viewer, you can transfer every table and every chart into your report with a simple copy & paste.

