What’s new in 
Take your research further with the newest features in Stata 18.
Bayesian model averaging
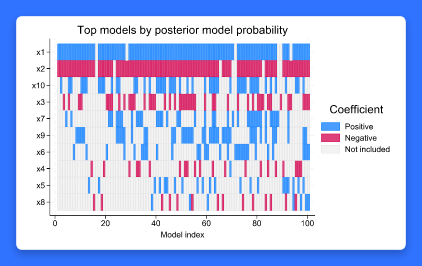
Uncertain which predictors to use in your regression?
Use Bayesian model averaging to account for this uncertainty in your analysis. Explore influential models and predictors, obtain better predictions, and more.
Causal mediation analysis
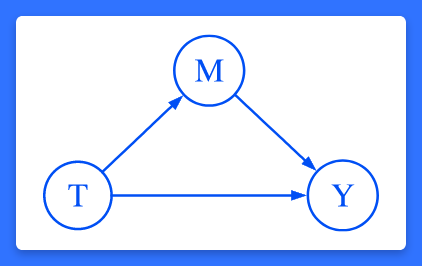
Causal analysis quantifies causal effects. Causal mediation analysis disentangles them.
Are these effects mediated through another variable? Estimate direct and indirect effects. Calculate the proportion mediated.
Heterogeneous DID
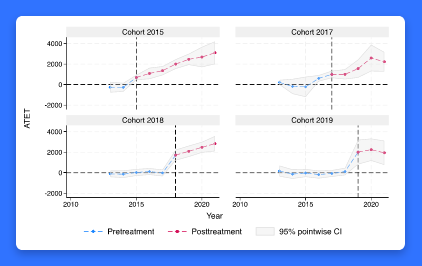
Estimate treatment effects that vary over groups and time. Fit models for repeated cross-sectional or panel data.
Visualize effects. Aggregate effects within group, time, or exposure to treatment.
All-new graph style
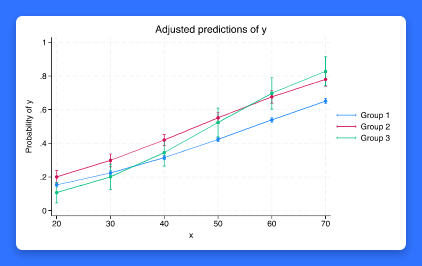
White background • Horizontal y-axis labels • Bright color palette • Side legend • And more
You can also graph colors by variable.
Table 1

Create tables of descriptive statistics more easily with the new dtable command!
Export to Word, Excel, PDF, LaTeX, HTML, Markdown, and more.
Alias variables across frames
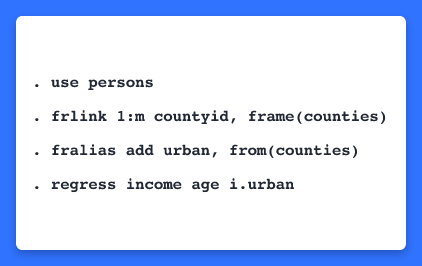
Use variables from multiple datasets as if they exist in one.
And you can now work with frame sets.
Group sequential designs
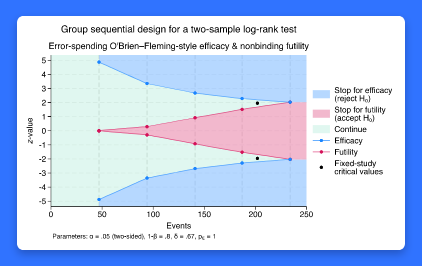
Calculate efficacy and futility stopping bounds for clinical trials. Find required sample sizes for interim and final analyses when testing proportions, means, or survivor functions.
Multilevel meta-analysis
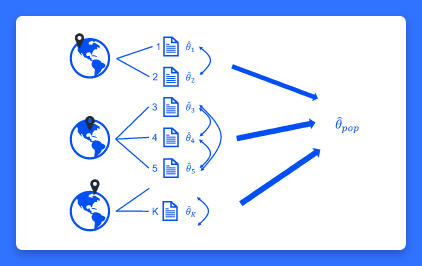
Do your studies have effect sizes nested within multiple grouping levels? Use multilevel meta-analysis to account for possible dependence among the effect sizes when combining results.
Meta-analysis for prevalence
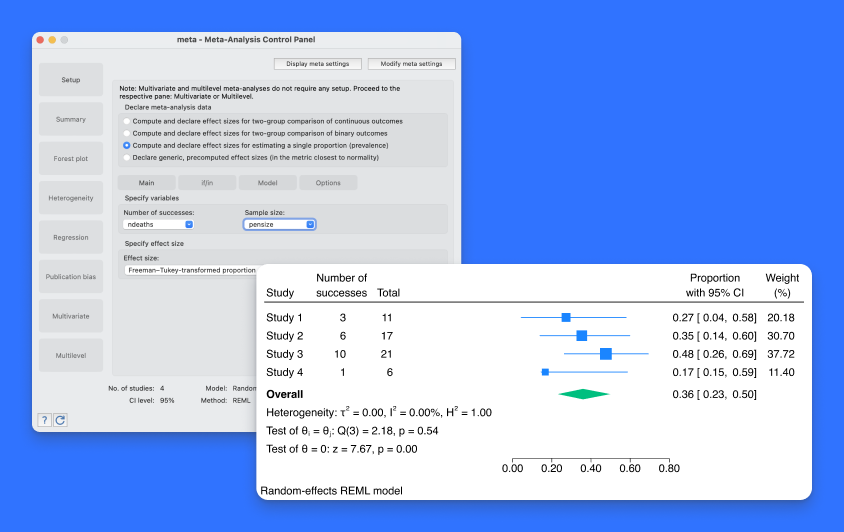
You asked, we delivered! Perform meta-analysis for proportion or prevalence. Produce forest plots. Explore heterogeneity. Perform subgroup analysis. And more.
Robust inference for linear models
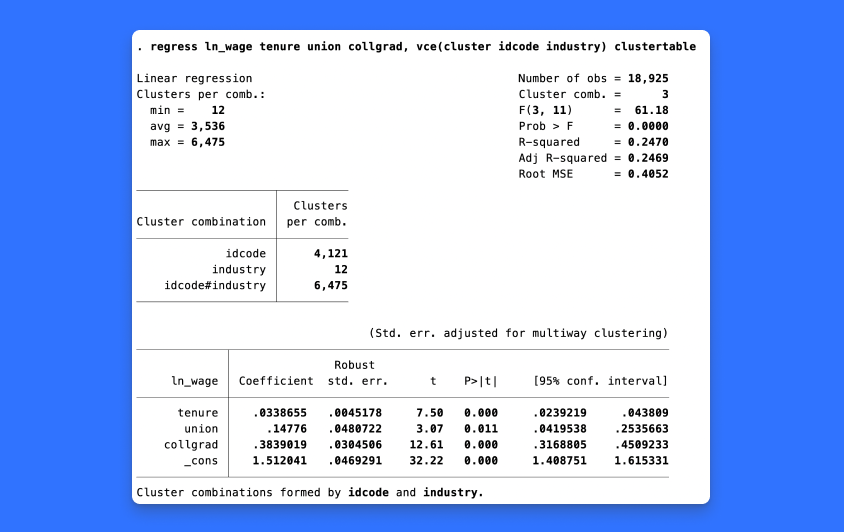
Stata’s robust features for linear models became even more robust. Learn how.
Wild cluster bootstrap

Small number of clusters? Unequal observations per cluster? No problem! Wild cluster bootstrap handles them all.
RERI
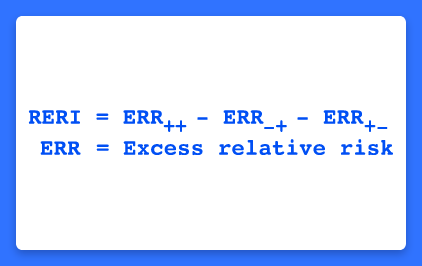
How do exposures interact to increase risk?
Use reri to find out.
TVCs with interval-censored Cox model
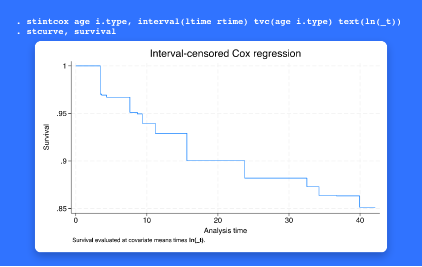
Incorporate time-varying covariates in your interval-censored Cox analysis, including prediction and plots of survivor and other functions!
Lasso for Cox model
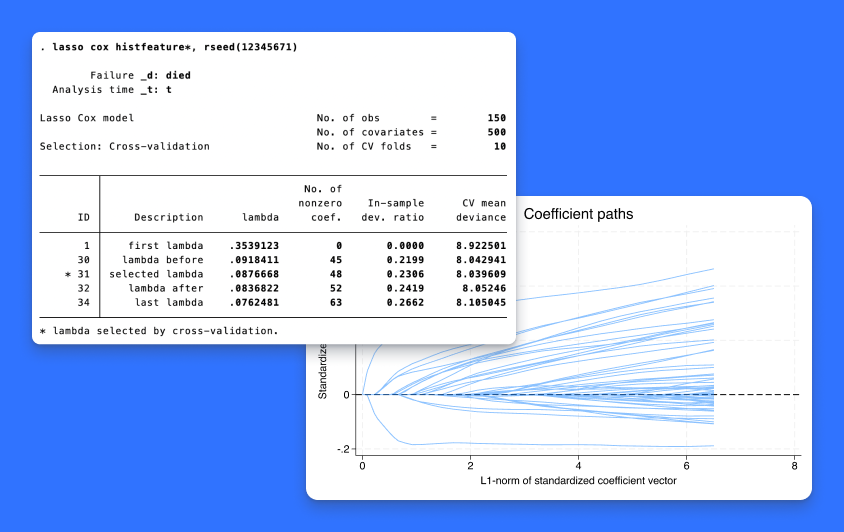
Select variables in a Cox model using lasso and elastic net.
Compute predictions. Graph survivor, failure, and other functions.
GOF plots for survival models
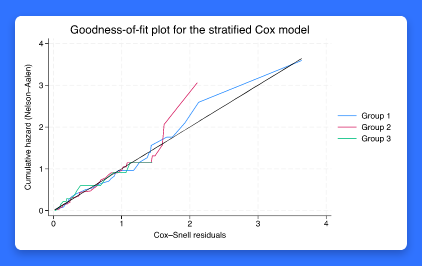
Want to know whether your survival model fits your data well? estat gofplot makes this easy. Use it with right-censored and interval-censored data, parametric and semiparametric models, and more.
Local projections for IRFs

Estimate impulse–response functions (IRFs) via local projections. Test hypotheses of multiple IRF coefficients. Graph IRFs, orthogonalized IRFs, and dynamic multipliers.
ARIMA and ARFIMA model selection
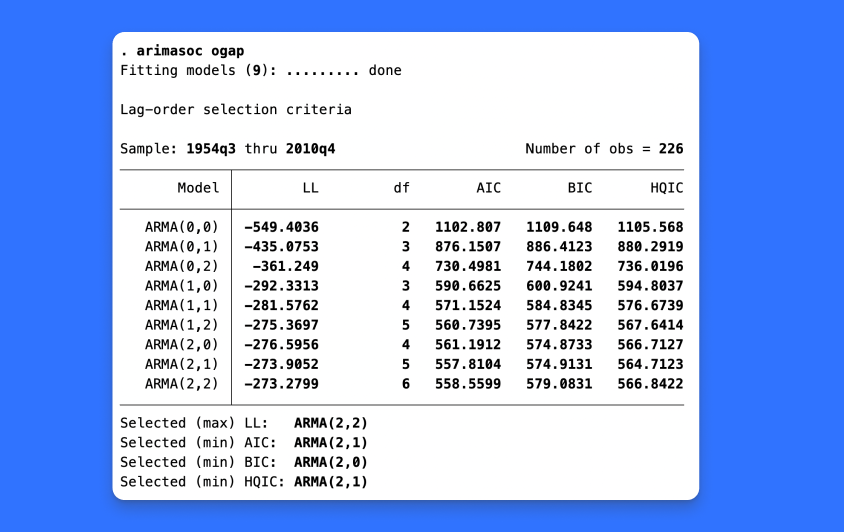
Compare potential ARIMA or ARFIMA models using AIC, BIC, and HQIC. Select the best number of autoregressive and moving-average terms.
Flexible demand systems
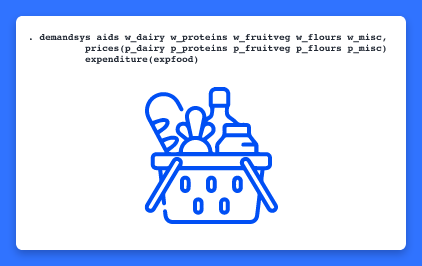
Estimate demand for a basket of goods. Evaluate sensitivity to price and expenditure changes. Choose from eight demand systems, including Cobb–Douglas, translog, AIDS, and QUAIDS.
IV quantile regression
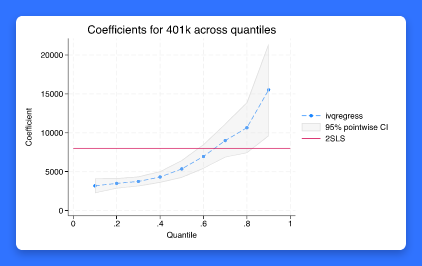
Estimate effects of covariates on quantiles of the outcome’s conditional distribution. Account for endogeneity. Plot coefficients across quantiles.
IV fractional probit model
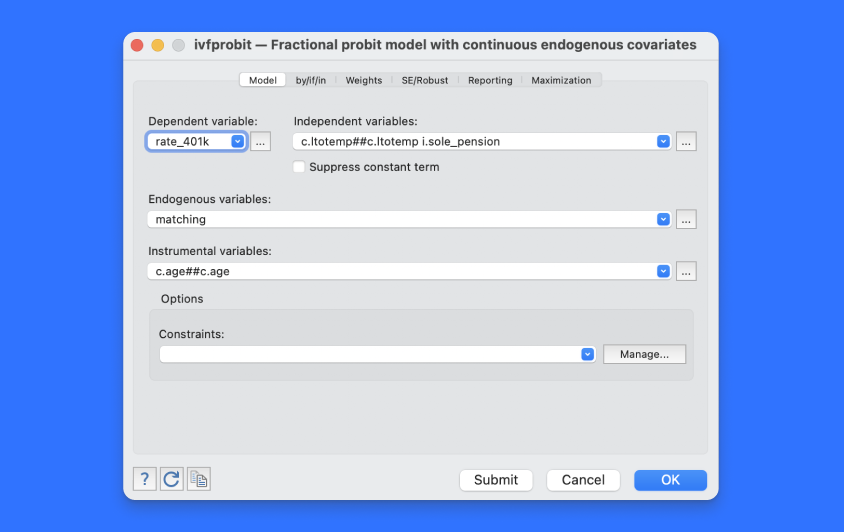
Modeling a proportion or rate?
Have endogenous covariates?
Fit your model with ivfprobit.
Interface enhancements
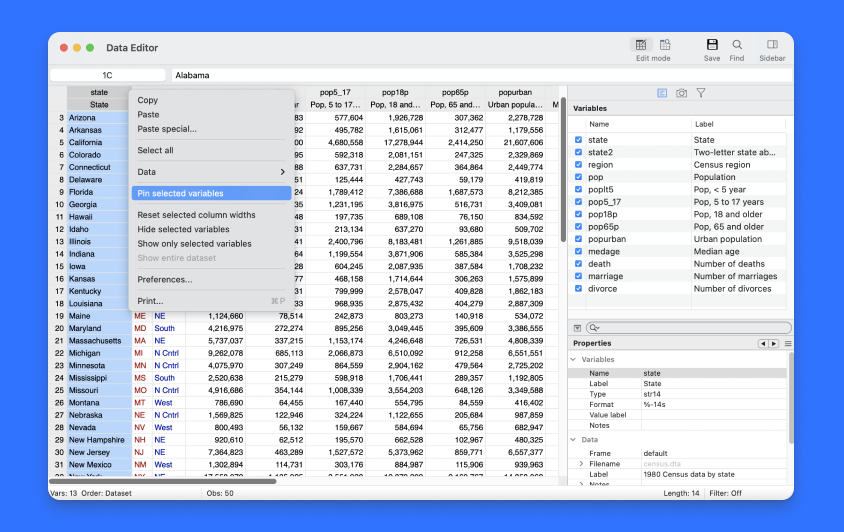
Data Editor—Pinnable rows and columns, tooltips for truncated text, variable labels in headers, much more.
Do-file Editor—Automatic backups and syntax highlighting for user-defined keywords.
And even more …
Corrected and consistent AICs
Compare models using consistent AIC (CAIC). Or, with small sample size, use corrected AIC (AICc).
New spline functions
Revamped spline generation tool—new makespline—supports B-splines and generates splines for multiple variables at once.
Vectorized numerical integration
Approximate multiple numerical integrals simultaneously. Adaptive Gauss–Kronrod and Simpson methods. Robustness to singular points.
Boost-based regular expressions
Regular expression functions now use Boost.
More features.
More functions.
New reporting features
putdocx: Bookmarks in paragraphs and tables, image text for voice software, and SVG images in Word.
putexcel: Freeze worksheets, add page breaks, include hyperlinks, and insert headers/footers in Excel.
More
-
Export to SPSS.
-
Bacon treatment-effect decomposition.
-
And even more.
