InStat
This overview, shown here in InStat Mac (Windows is very similar), will demonstrate how easy it is to perform one-way ANOVA using InStat in just a few minutes.
Step 1: Choose data format
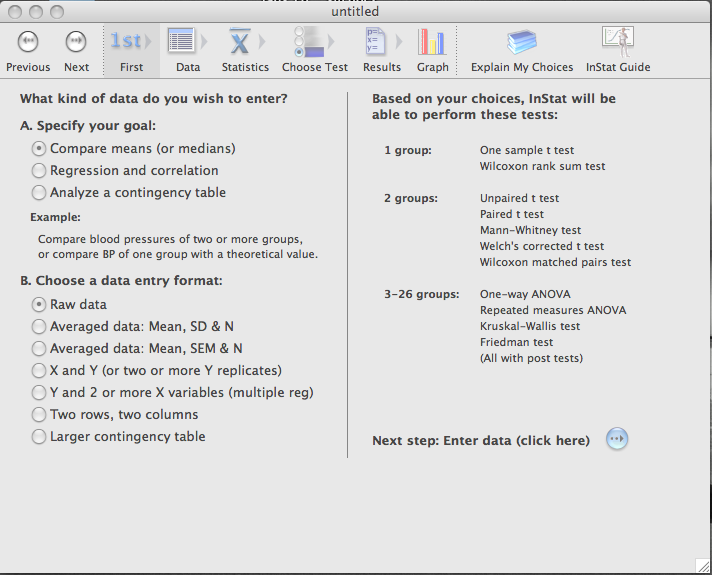
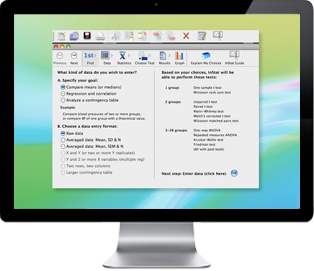
Before you can enter data, you first have to tell InStat what kind of data table you need. This important step makes InStat unique. Once you’ve chosen the right kind of data table for your experiment, InStat will be able to guide you to choose an appropriate statistical test. InStat offers three goals on the top of the screen, with more choices below. Based on your choices, you’ll be able to perform different tests as shown on the right. The three goals are distinct, and you shouldn’t have a problem telling InStat what kind of data you have.
For this example, we will select Compare means and Raw data.
Step 2: Enter data
Type, import or paste data onto InStat’s data table. The Data menu lets you transform data or create new variables by combining columns.
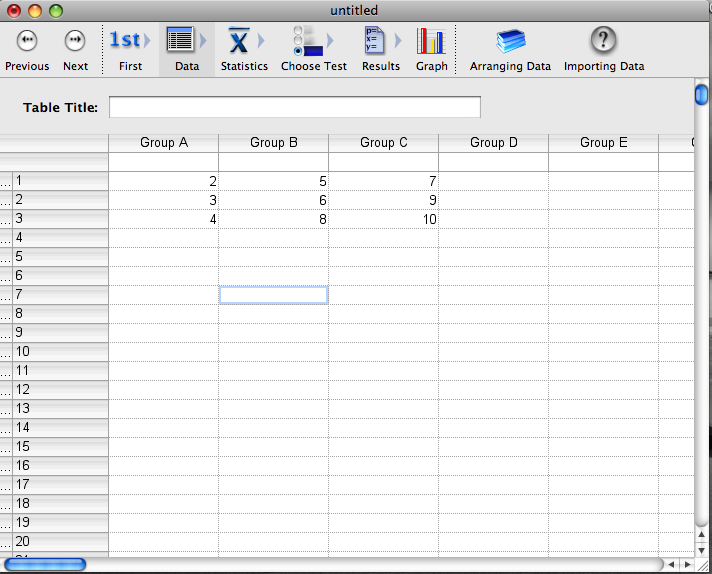
Note the six step buttons at the top of the program. You can use these buttons to move from step to step in any order or you can use the arrow buttons to move in sequence. The third button goes to the next step, summary statistics.
Step 3: Summary statistics
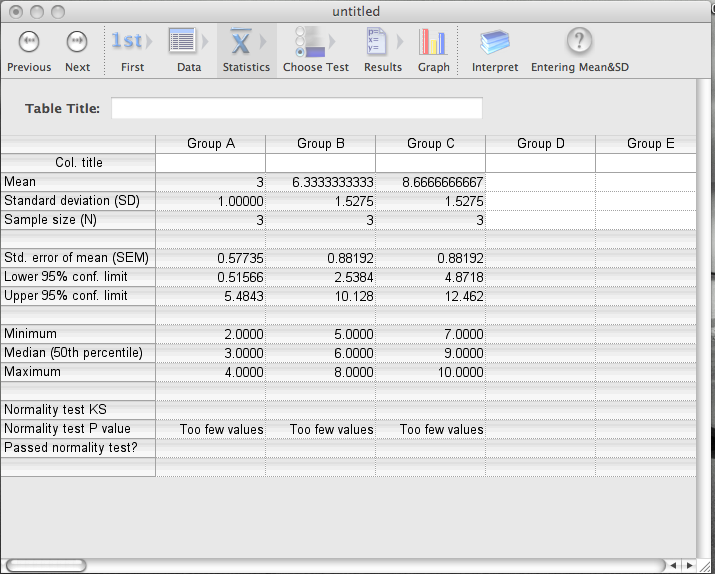
For each column, view the mean, SD, SEM, confidence interval, etc. You can also enter the mean, sample size, and SD (or SEM) here if you have already analyzed data in another program.
Step 4: Select a statistical test
To guide you to select a test, InStat presents four questions. You would see different choices if you entered a different number of columns of data, or if you created a different kind of data table.
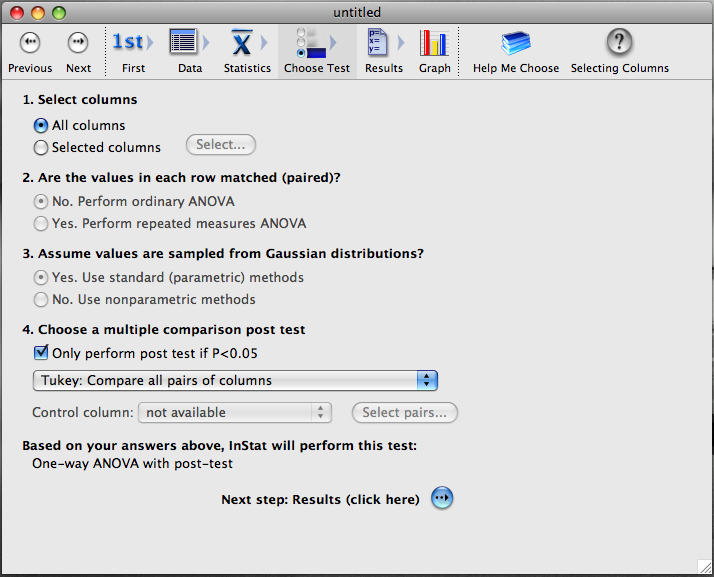
Based on the choice shown above, InStat tells you that it chose one-way ANOVA with post-test. If you need guidance, click Help me choose to view InStat’s explanations.
Step 5: View the results
InStat presents the results using as little statistical jargon as possible.

The sixth step button shows a simple graph, suitable for getting the sense of your data and to spot errors in data entry. You cannot change or edit the graph, but can print it or copy it to the clipboard.
You don’t have to follow the steps in order. When you edit data or change analysis choices, InStat instantly recomputes the results.
Column Statistics
- Mean, median, 95% CI, SD, SEM. Also tests whether the distribution conforms to a Gaussian distribution using the Kolmogorov-Smirnov test.
Group Comparisons
- Paired and unpaired t tests; Mann-Whitney and Wilcoxon nonparametric tests.
- Ordinary and repeated measures ANOVA followed by Bonferroni, Tukey, Student-Neuman-Keuls or Dunnett post tests.
- Kruskal-Wallis or Friedman nonparametric tests followed by Dunn post test.
Contingency Tables
- Chi-square test with or without Yates’ continuity correction.
- Chi-square test for linear trend.
- Fisher’s exact test.
- Calculate 95% confidence intervals for the relative risk, odds ratio or difference between two proportions.
- Calculate the sensitivity, specificity, positive predictive value, negative predictive value and likelihood ratio with 95% confidence intervals.
Linear Regression and Correlation
- Calculate slope and intercept with 95% confidence intervals.
- Force the regression line through a specified point.
- Interpolate from a standard curve.
- Calculate correlation coefficient (Spearman or Pearson) and its confidence interval.
- Test for departure from linearity with a runs test or the F test for linearity.
Multiple Regression and Correlation
- Calculate a correlation matrix.
- Multiple regression using selected X variables.
- For each X variable, compute its best-fit coefficient with standard error and 95% confidence interval, and a P value testing whether the variable contributes significantly to the model.
- Compute the Variance Inflation Factor (VIF) to test for multicollinearity.
Graphing Capabilities
InStat makes notebook quality graphs (not editable). For publication quality graphs, use GraphPad Prism.
What InStat Does Not Do
We designed InStat to simply perform and teach basic statistical tests. Many labs find that InStat is all they need. Other labs sometimes require more advanced statistical tests, or the ability to select subsets of data from large databases. These labs will need a heavy-duty statistical package in addition to InStat. InStat does not perform two-way ANOVA or survival analysis, but Prism, our graphing and curve fitting program, does. InStat also does not perform logistic regression, stepwise multiple regression, factor or cluster analysis, or ANCOVA.
Program Features
- Up to 10,000 rows and 52 columns of data.
- Mathematically transform selected data (i.e., log, reciprocal, logit, etc.).
- Transpose rows and columns.
- Copy results or data to the clipboard, or export as a text file.
- Print graphs on any printer or export as Windows Metafile (.WMF) or PICT (Mac) files.
- Annotate your data and analyses using a built-in notes editor.
- InStat files contain analysis choices as well as data so you can quickly rerun the same test with new data.
- Combine 2 columns (add, subtract, multiply, divide) to create a new column.
- Import comma or tab delimited files.
- Import indexed (stacked) data, entire tables or selected rows and columns, filter selected data.
- Export the data table as a text table, or as indexed (stacked) file.
- Exclude selected values. They appear on the data table, but are treated as missing values by the analyses.
Clear analysis choices with explanations
You don’t have to know the name of the test you need. InStat helps you pick an appropriate test by asking questions about your data. If you are unsure, consult the extensive help screens, which explain the statistical reasoning in plain language.
Easy to understand results
InStat does not assume that you are a statistics whiz. It presents results in simple paragraphs, with a minimum of statistical jargon. InStat’s help screens review the use of each test and explain every portion of the results.
A bargain
Most other statistics programs cost several hundred dollars, but we’ve made InStat affordable for everyone.
Unique analysis checklists
With other statistics software, it is too easy to get the right answer to the wrong question. That’s why InStat provides a unique analysis checklist. Double-check that your data have not violated any assumptions of the test, and that you have picked a test that matches your experimental design and really answers the question you had in mind.
