New In 
Lasso

All the expected tools for model selection and prediction.
- Cross-validation
- Goodness of fit
- Coefficient paths
- Knot analysis
- Lasso and elastic net

Alongside cutting-edge inferential methods
- Robust to mistakes in variable selection
- Proper inference for coefficients of interest
- Double selection, partialing out, and cross-fitting
Continuous, binary, count outcomes
Reproducible Reporting
Create Word, HTML, PDF, and Excel files with Stata results and graphs.
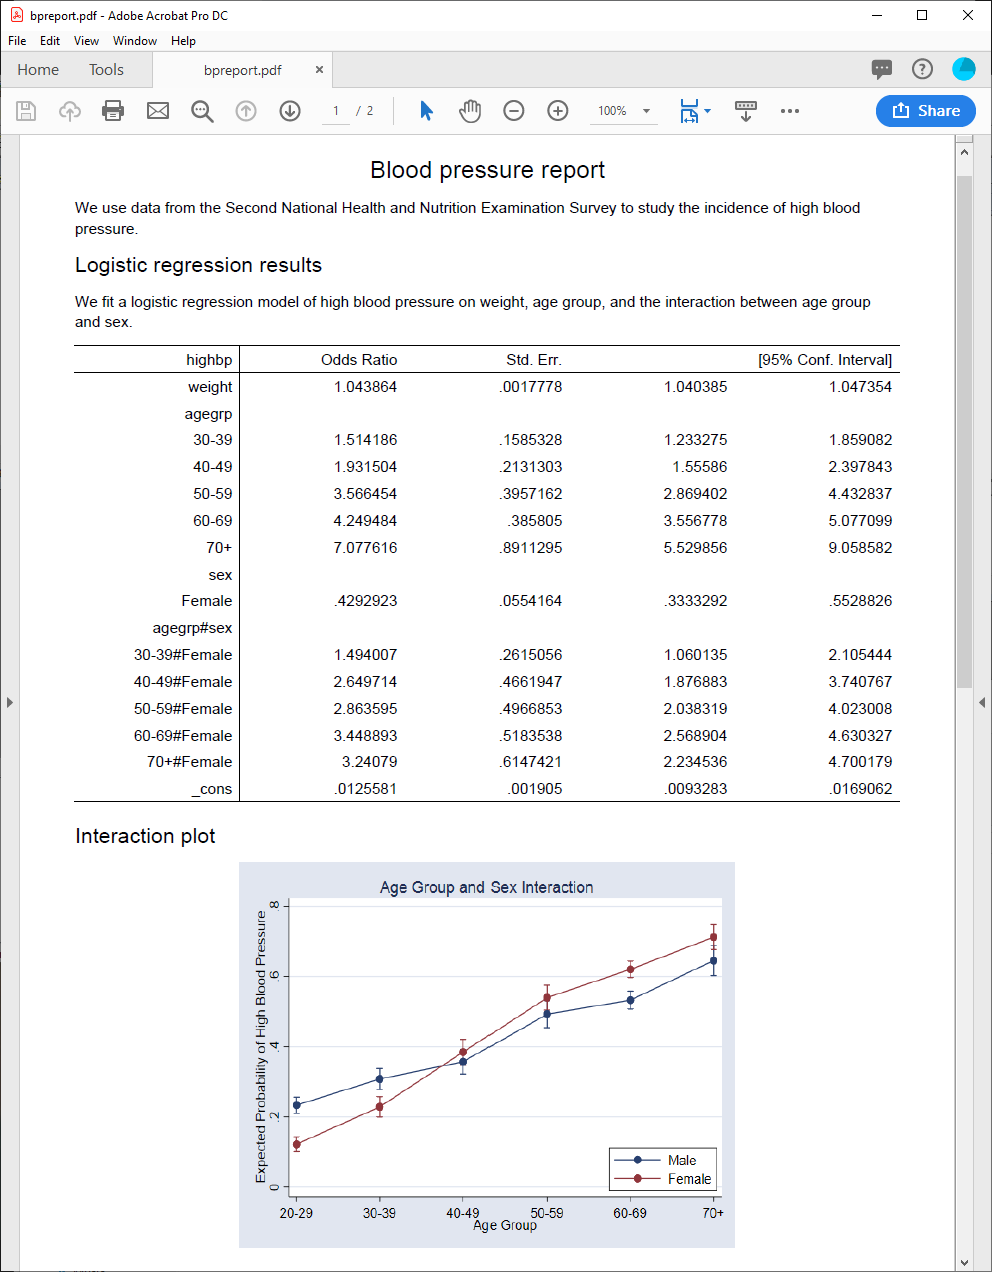

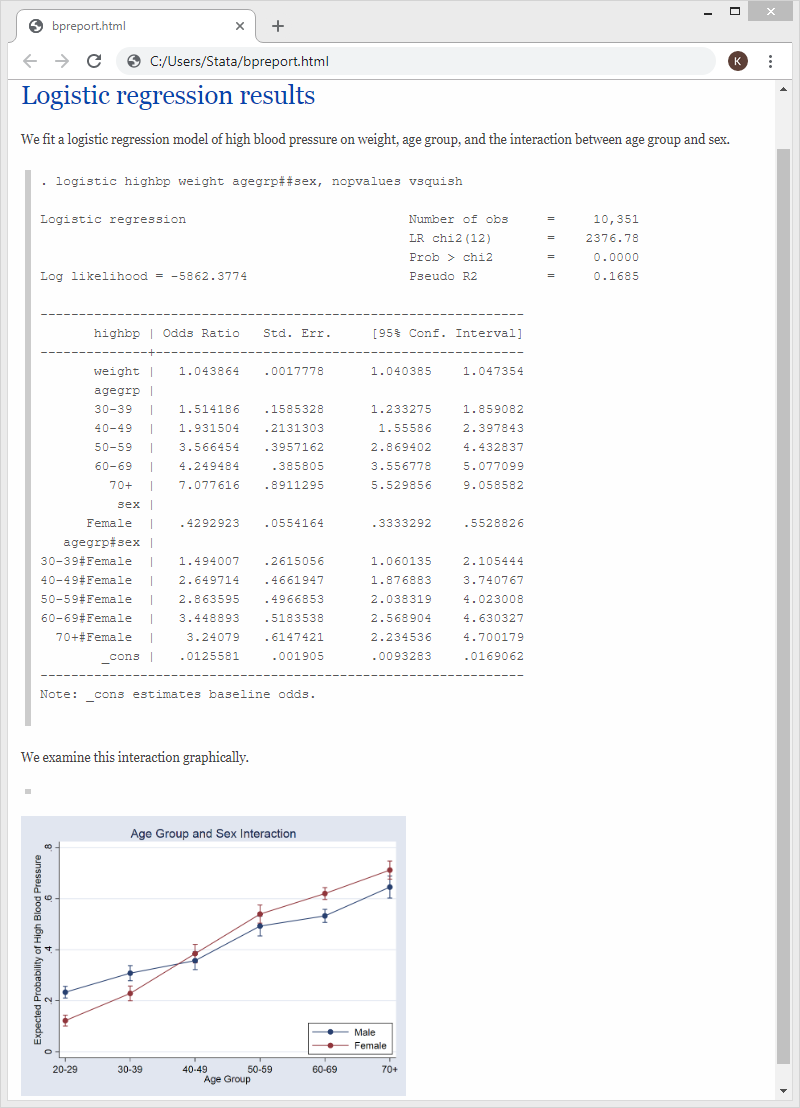
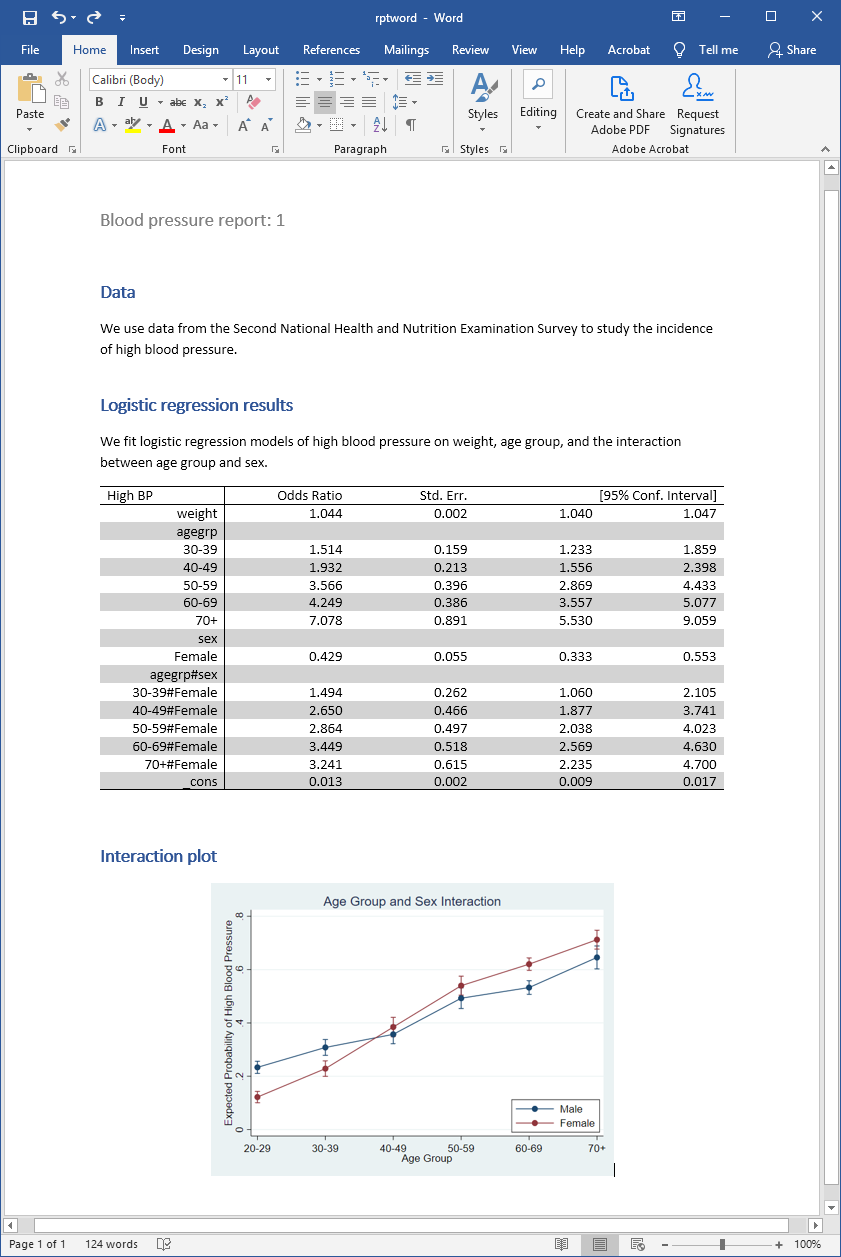
Stata’s integrated versioning gives you truly reproducible reporting. Want dynamic documents? All of these reports can be updated as your data change.
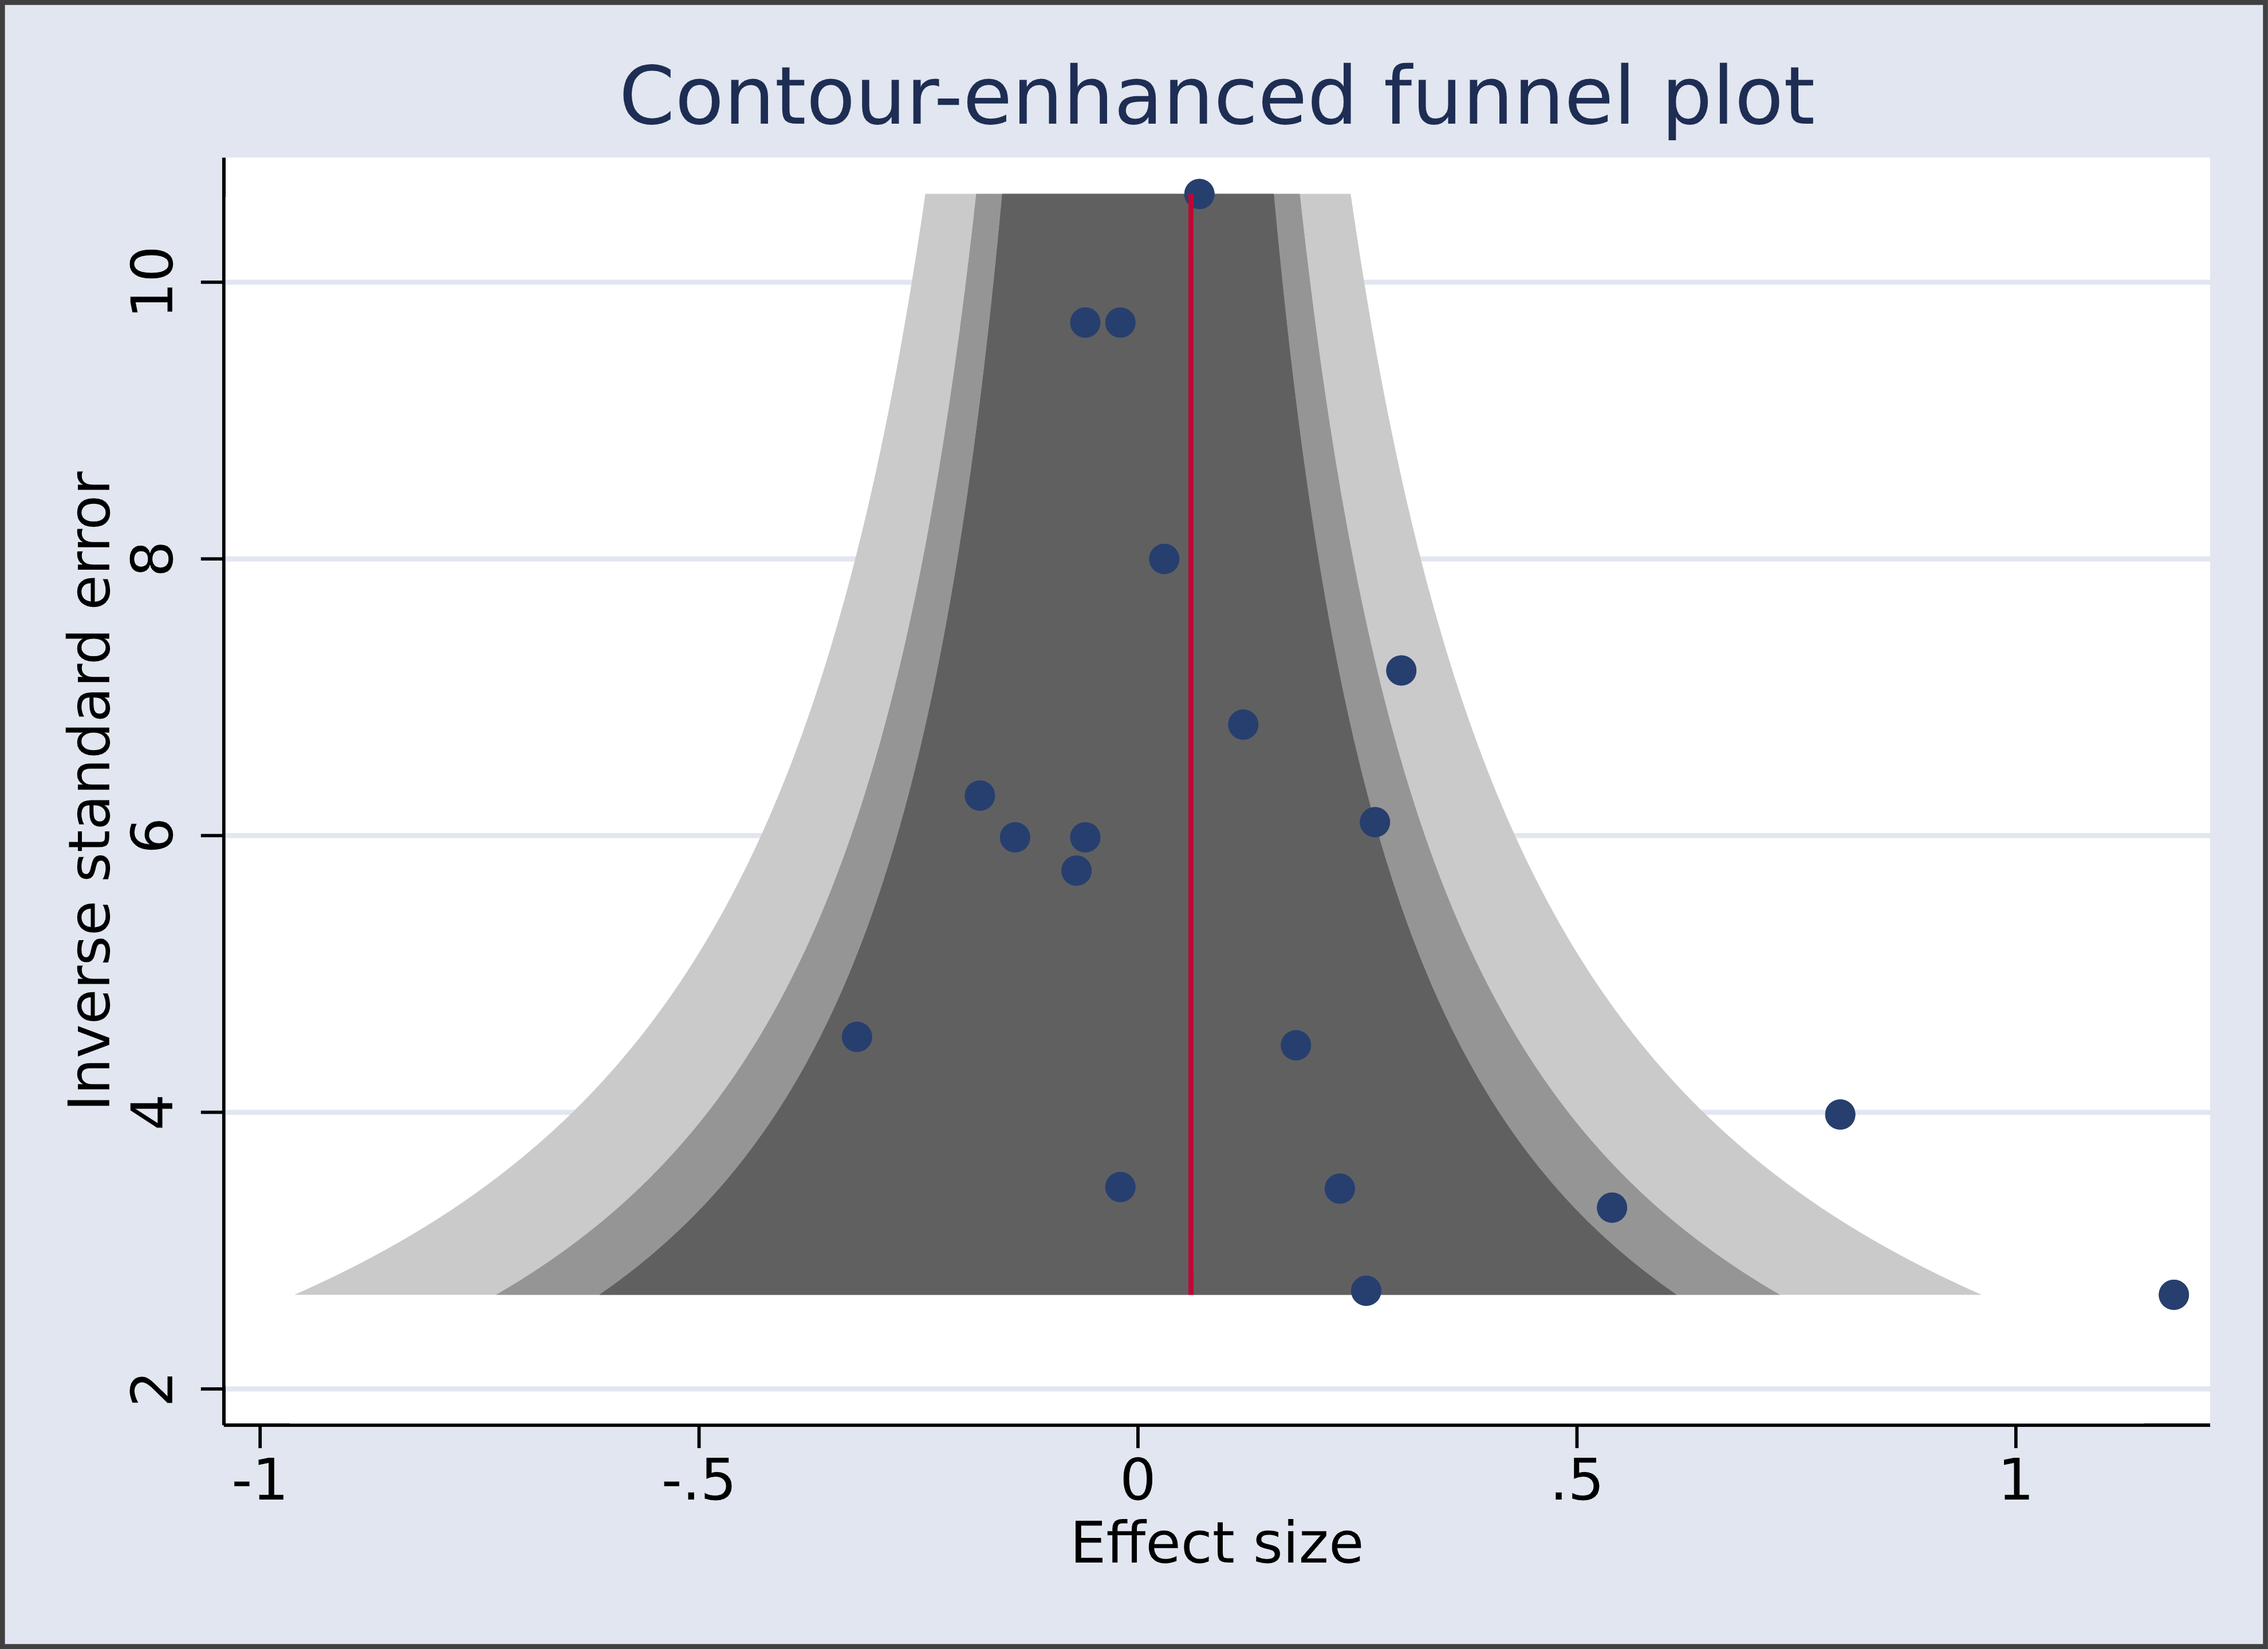
Meta – Analysis

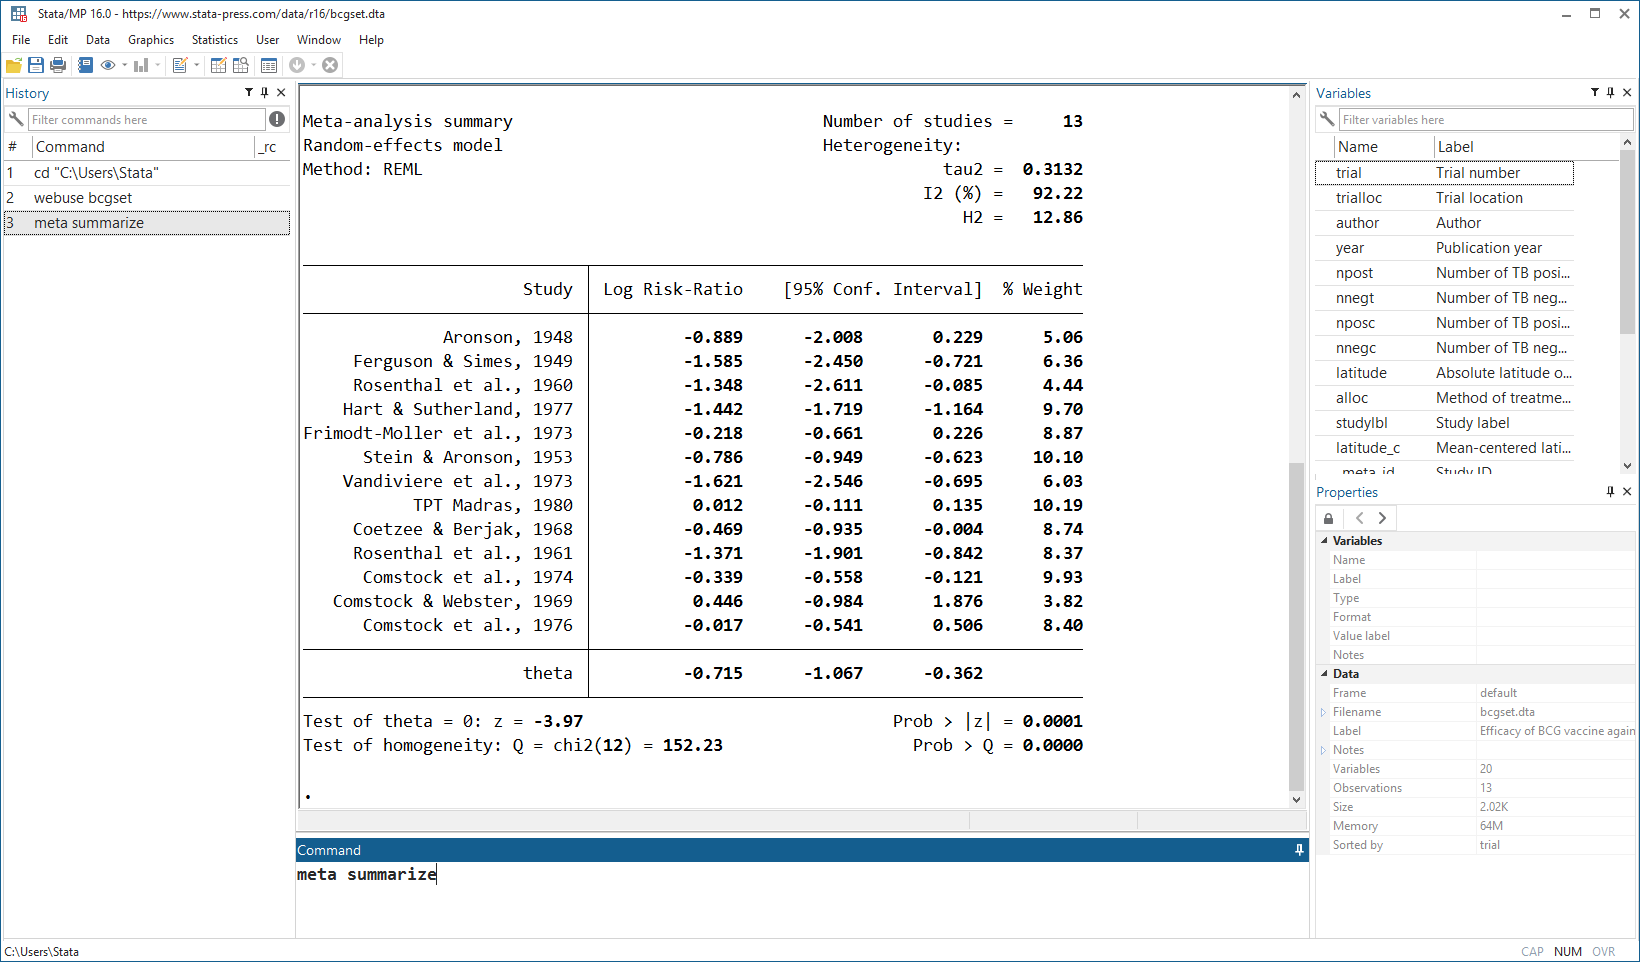
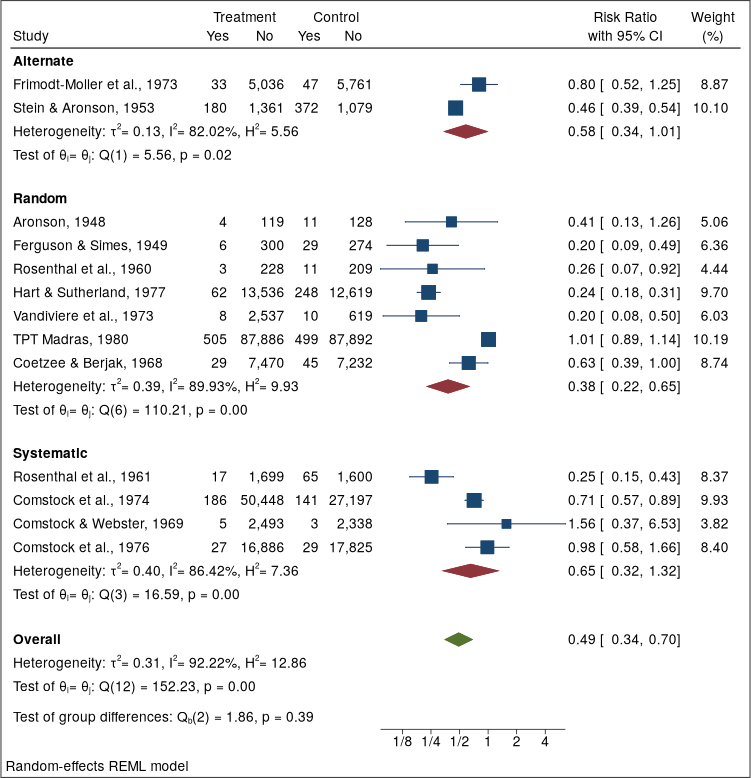
With Stata’s new meta-analysis suite, you can easily summarize results from multiple studies.
- Estimate an overall effect size
- Perform random-effects, fixed-effects, or common-effect meta-analysis
- Display results in a forest plot
- Analyze subgroups
- Perform meta-regression
- Explore small-study effects
- Evaluate publication bias
- Perform cumulative meta-analysis
Choice Models
With Stata’s new and unique choice-model analysis features, you can truly interpret the results of your choice model.

What proportion of travelers are expected to choose air travel?

How does each additional $10,000 of income change the probability of traveling by air?

Wait times at the airport increase by 30 minutes. How does this affect the probability of traveling by air? By train? By bus? By car?
Python Integration
Use any Python package from within Stata

- Matplotlib for 3-D graphs
- Scrapy for scraping data
- TensorFlow for machine learning
New In Bayesian Analysis
Multiple chains


Gelman-Rubin convergence diagnostics

Posterior predictive p-values
Panel – Data ERMs

Endogeneity +
Selection +
Treatment +
Panel data
Handle all of these complications simultaneously.
Import Data From


Nonparametric Series Regression
Agnostic about functional form? Poisson or negative binomial? Cubic or quadratic on a covariate?
No problem.
With nonparametric regression, you can explore the response surface, estimate population-averaged effects, perform tests, and obtain confidence intervals.


Frames — Multiple Datasets In Memory

- Load datasets simultaneously into frames.
- Link related frames.

- Multitask.
- Record results in another frame.

- Make code run faster.
Sample – Size Analysis For CIs
How many subjects are needed to achieve a confidence interval of the desired width?


Perform sample size-analysis CIs for
- One mean
- One variance
- Two independent means
- Two paired means
- Your own method


Tabular results and automated graphs
Panel – Data Mixed Logit
You choose dinner everyday.
You choose your car insurance every year.
You choose where to vacation each summer.
Now you can account for the you-ness in those decisions.
Nonlinear Dynamic Stochastic General Equilibrium (DSGE) Models
Now you can leave the linearization to us.


Specify your nonlinear model and evaluate policy implications
Solve
Estimate
Calibrate
Graph
Multiple – Group IRT


Fit multiple-group IRT models
- 1PL, 2PL, and 3PL models for binary outcomes
- Graded response, partial credit, and rating scale models for ordinal outcomes
- Nominal response models for categorical outcomes
Compare estimates across groups
- Item difficulty
- Item discrimination
Graph group differences
- ICCs, TCCs, IIFs, TIFs
Perform model-based tests of differential item functioning

Nonlinear Mixed – Effects Models With Lags, Leads, And Differences
- Multiple-dose pharmacokinetic models
- Growth models
- More

Point Sizes For Graphics

Now specify the size of text, markers, margins, lines, and more using printer points, centimeters, or inches.


